ABSTRACT
This ESG Technical Review describes the joint HPE and Qumulo solution that delivers high-performance storage with real-time visibility and enterprise services for unstructured data. The report includes results of remote testing of the Qumulo File Data Platform.
The Challenges
Many organizations are focused on digital transformation to help them get the most benefit from all of their data. According to ESG research, that focus is driven by the desire to become more operationally efficient, improve the customer experience, and develop data-centric and innovative products, services, and business models (see Figure 1).1
Figure 1. Digital Transformation Objectives
What are your organization’s most important objectives for its digital transformation initiatives? (Percent of respondents, N=619, three responses accepted)
Source: Enterprise Strategy Group
However, unstructured data growth can hinder these objectives. Continued expansion of file data inhibits storage performance, delaying time to value for data insights, in addition to creating a management burden. Organizations struggle to deliver the performance and scale required for unstructured, data-driven workloads, including medical imaging, media & entertainment, research, IoT, analytics, video surveillance, life sciences, and manufacturing. Parallel file systems have been used for some of these workloads, but these are often complex, closed systems that are difficult to manage.
The Solution: HPE Storage With Qumulo File Data Platform
This joint solution pairs high-performance, efficient HPE storage with Qumulo’s file data platform to deliver enterprise-class unstructured data services. Customers can take advantage of the power, performance, and scalability of the joint solution to consolidate applications for greater efficiency and cost savings. Workload consolidation can reduce NAS infrastructure sprawl and can include not only typical home directory data, but also data-intensive workloads such as animation rendering, imaging, IoT, machine learning (ML), artificial intelligence (AI), and video surveillance.
Qumulo provides a software-defined, distributed file system wherever your data resides, on-premises or in the cloud. The single namespace supports application consolidation while maintaining high performance. All current and future features are included with the software license. Key features include:
- Integrated, real-time analytics for data intelligence without time-consuming tree walks. With Qumulo, administrators can instantly understand performance, capacity, file, directory, and client details for fast problem resolution, better infrastructure planning, and improved application profiling.
- Dynamic scalability with automatic cluster rebalancing.
- Single tier with ML-based predictive caching. This speeds data access without time-consuming and costly administrative intervention or tiering.
- Automation via REST API, which enables easy management despite massive file data growth.
- Integrated data protection, including snapshots, replication, and pre-allocated, block-level erasure coding, which eliminates the need to leave capacity headroom to ensure performance.
- Cloud-based monitoring and historical data. Details include 52 weeks of capacity, file/directory counts, throughput, IOPS, disk utilization, CPU, latency, metadata, clients, system temperature, etc.
- Cloud-native file system, which delivers the same experience (in fact, the same software) across edge, data center, and multi-cloud environments. Qumulo Shift lets organizations move data to native AWS S3 object storage without refactoring.
- Fully programmable API for agile development and easy integration of real-time insights. Every analytic detail has an API endpoint for custom reporting.
- Software-based 256 AES encryption of data at rest, on by default. No encryption management or controllers are needed, enabling full-speed drive access.
- 20-second upgrades of the entire cluster, regardless of size with Qumulo Instant Upgrade. The Qumulo software-defined file data platform is container-based, so when upgrading the platform, you simply redirect a pointer to the new version.
- Ability to leverage 100% of useable capacity without performance degradation. Qumulo’s scalable block store back-end reclaims space from data deletions in the background, eliminating the gaps of log structured files systems.
Figure 2. HPE Storage Platforms with Qumulo File Data Platform

HPE Cloud Volumes Block
Customers choose from two high-powered HPE storage systems:
- HPE ProLiant DL325 Gen10 Plus for consistent high performance. This platform delivers high performance in a dense, 1U form factor with up to 145 TB of All-NVMe drives. The 2x dual-port 100Gb NICs separate the cluster and user networks to unlock the full performance potential. The AMD EPYC processor enables 128 lanes in a single CPU to drive PCIe Gen4 connections at full, non-bus-limited speed. There are no additional components such as controllers or switches, which minimizes the platform’s complexity, cost, and power requirements. HPE and Qumulo report the following results:
- At 1PB of usable capacity, the storage delivers 40GB/s of throughput, scaling to 450GB/s throughput, in a single filesystem.
- Starting systems provide enough multi-stream read performance to enable customers to analyze more than 1.5PB of data per day, extracting actionable insights at scale.
- Applications can read about 66TB per hour depending on the workload.
- HPE and Qumulo report that using machine learning-based predictive caching, high-performance configurations providing 1PB of usable capacity that delivers 20GB/s of multi-stream read throughput depending on the configuration and workload, enabling faster results while fitting into tighter budgets.
- At 1PB of usable capacity, the storage delivers 40GB/s of throughput, scaling to 450GB/s throughput, in a single filesystem.
- For less performant workloads like video surveillance, the active archive configuration provides even better economics at scale.
Both systems deliver the high horsepower that data-intensive workloads need in today’s demanding application landscape.
ESG Validation Highlights
ESG validated some of the key features of the joint HPE/Qumulo solution through demonstrations and a review of customer successes. The demos used a test bed in Qumulo’s Seattle, WA headquarters2 and were focused on the ease of use and real-time analytics capabilities that help customers not only quickly and accurately troubleshoot for maximum productivity, but also better understand application profiles and true infrastructure needs.
Dashboard
Our validation began with a view of Qumulo Core’s dashboard, which provides customers with important details about their clusters at a glance. It is most important to realize that this dashboard is built using real-time data. Right away, the administrator can see the total used capacity, including percentages of data, metadata, snapshots, and available capacity. On the right, the dashboard shows the numbers of files and directories, plus the number of each per minute as they are added and deleted in real time. The graphs show real-time IOPS, throughput, and latency, with purple lines for reads and aqua for writes (see Figure 3).
Figure 3. Qumulo Real-time Dashboard: Overview
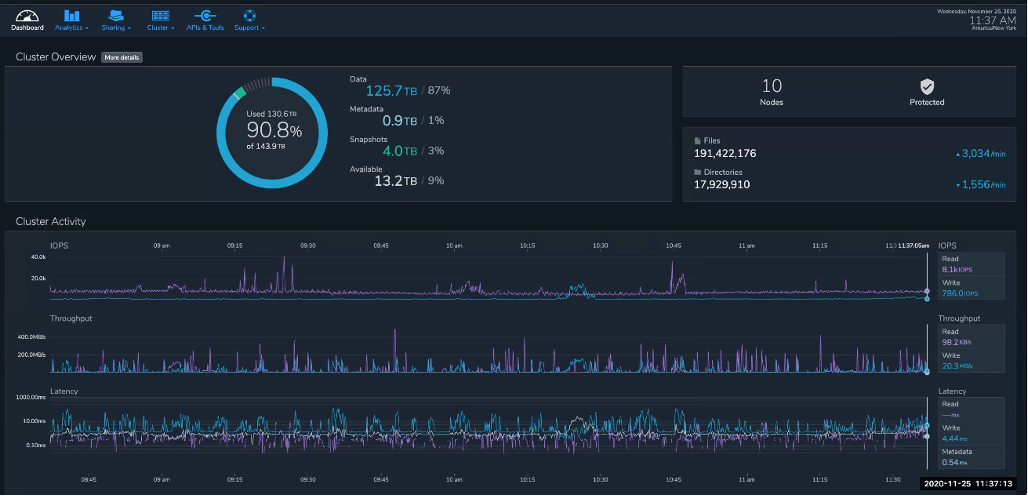
An essential feature of the Qumulo file data platform is the distributed architecture on which the file system is based. This enables retrieval of analytical details without the time-consuming tree walks of other file systems. When the user clicks on Root to see the real-time details of files, capacity, performance, etc., in that directory, Qumulo simply queries for those analytics that it has already collected and displays them. This enables the instant access to file system details.
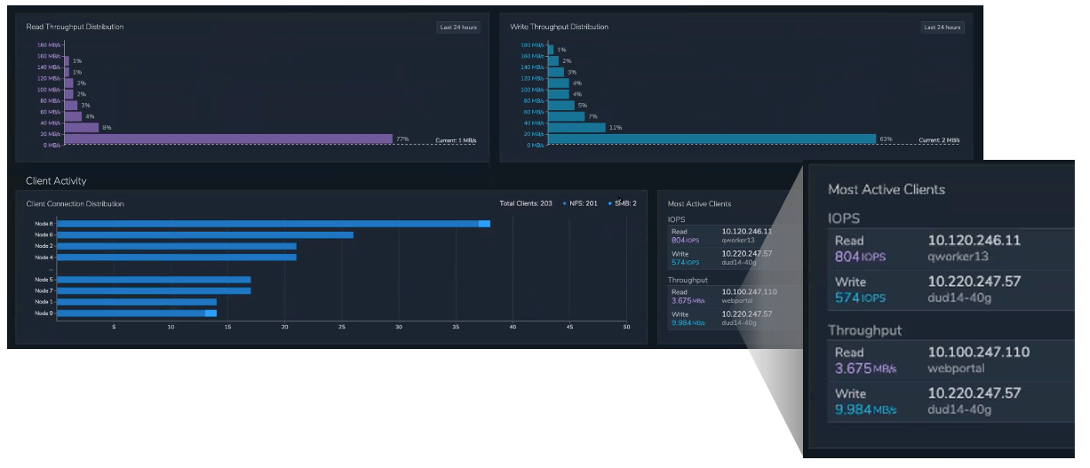
Scrolling down in the visual interface, the administrator can view 24 hours of aggregate IOPS, throughput, and latency across the cluster; real-time data is available simply by dragging the cursor to collapse the window. Next, the system shows detail that helps to understand what I/O sizes are stressing the system, followed by which clients have the most activity (see Figure 4). These details can help to identify problematic workloads and clients when troubleshooting. They also help customers understand their true infrastructure needs; many over buy storage based on assumed peak-throughput needs and can make more accurate purchases when they discover their actual needs. The purple (read) and aqua (write) bar charts show throughput distribution; in this case, the bulk of the I/O is in small 1-2 MB files for both read and write. The blue bar chart shows the total number of NFS and SMB clients per node, and detail at the bottom right shows most active clients in terms of read and write IOPS and throughput.
Figure 4. Qumulo Real-time Dashboard: Throughput Distribution and Client Activity
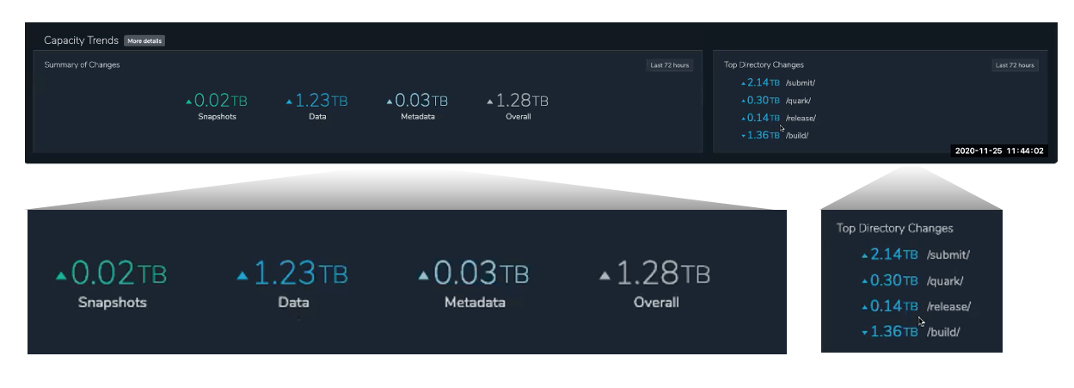
Finally, the dashboard shows capacity changes over the last 72 hours (see Figure 5). This is extremely helpful when administrators come in after a weekend, for example, and need a fast update on any changes in status. By showing capacity changes and top directory changes, the dashboard can help them immediately see problems and find causes, such as a runaway job that is jamming the system.
Figure 5. Qumulo Real-time Dashboard: Capacity Trends
WHY THIS MATTERS
Resolving problems and understanding how applications use file storage have historically been difficult. While applications have event logs and networks have tracing tools, storage has traditionally been a black box—and a black hole.
ESG validated that the Qumulo Core dashboard provides real-time insight at a glance, enabling customers to quickly understand their clusters’ capacity and performance profiles at any given time, as well as understand which clients, directories, and files are most active. This dashboard provides the key information required to get an overview of cluster status and fast identification of problem areas.
Integrated Analytics
While the overview is helpful, Qumulo Core has built in much more granular detail for real-time analytics. ESG selected Analytics/Integrated Analytics in the top navigation, and the screen was divided into boxes representing the root and sub-directories of the file system (see Figure 6). Each one displayed real-time read and write throughput (striped boxes), IOPS (solid boxes), and metadata (lined boxes). With a click, the left navigation displayed real-time size, directories, files, and named streams, plus top activities by client and by path. We could drill into details of any directory simply clicking on it.
Figure 6. Integrated Analytics: Top Activity
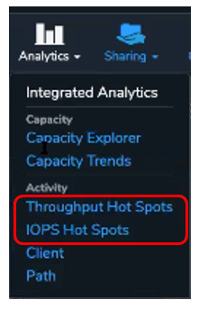
This allows administrators to get a clear view of performance and activity detail from a storage perspective. Qumulo Core also shows throughput and IOPS hot spots, displaying a real-time, continually changing chart. Whatever section of the file data platform is handling the most reads and writes can be identified with a mouse click; this allows administrators to see exactly which application is writing a lot of files to storage. They don’t need to know anything about the applications but can see immediately what’s going on—who’s writing to the file system, where, and how much.

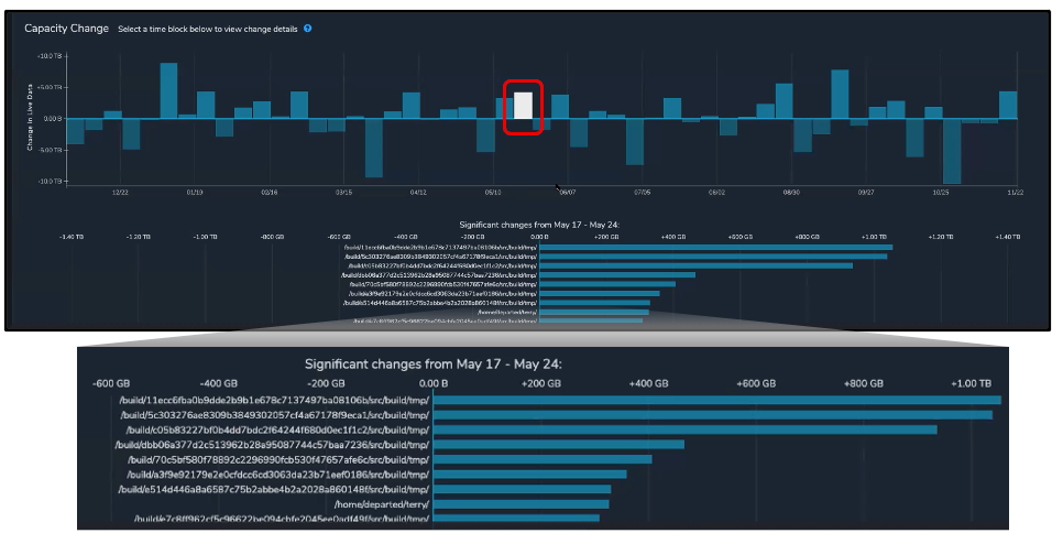
This system also helps organizations truly understand their application profiles. Which applications are IOPS-intensive, and which are throughput-intensive? More detailed capacity trends are also available from a link under Integrated Analytics, showing where growth is coming from by hour, day, month, or year. Figure 7 shows capacity changes by month, with the details of the white bar shown below, showing the biggest capacity changes by directory over seven days. This kind of information is typically not readily available, since most directory structures are laid out by application or business unit. When IT teams ask the CFO for more capacity, it is extremely helpful for them to show exactly where last year’s capacity investment went; finance can calculate the business value of that storage. Capacity trends also let organizations proactively manage storage purchases instead of reacting to urgent needs.
Figure 7. Integrated Analytics: Capacity Changes by Time Period
Similar details are also available under Integrated Analytics/Activity for individual clients, identifying performance details by IP address and resolved DNS name, and by path, identifying each server’s read/write IOPS, throughput, latency, and metadata. With Qumulo, administrators can see exactly which server is causing a slowdown for others.
There is significantly more detail and data that Qumulo captures and shows, but it would be overwhelming to include it all in the visual interface. However, customers can programmatically pull any details for any time period using the REST API to custom-build metrics with their own tools and analytics applications such as Splunk, Elasticsearch, or ELK Stack.
WHY THIS MATTERS
Storage analytics that only show high-level overviews, or that take weeks to collect, cannot help administrators troubleshoot on a daily basis or provide timely insights into application profiles for capacity and performance management.
ESG validated that Qumulo on HPE storage provides real-time insight so that customers know exactly how much capacity their file data is using to improve business planning.
- Organizations can make better informed decisions—while in the past, they might have added more capacity in hopes of preventing problems, now they can quickly determine the actual root cause, which could be unrelated to the storage system. Or, if no application ever reaches the 5GB throughput threshold that drove their last storage purchase, organizations might make the next purchase a lower-performance, less-costly tier.
- Instead of going to a department to ask what users are doing that might be causing a bottleneck, now IT can tell them what is wrong: for example, a script running on XYZ client seems to be killing the metadata.
- Organizations can also clearly identify the level of productivity of the infrastructure so that the business can see the impact of data.
The Bigger Truth
Enterprise organizations today need infrastructure that delivers sustained high throughput and low latency. They depend on applications that are running business-driving analytics, training machine learning models, rendering animation, analyzing machine data, doing genomic research, and much more. They need a solution that delivers all the high performance and enterprise data services without the complexity and that can work with data wherever it resides.
With HPE and Qumulo, organizations get the high performance and data services they need, including easy management, built-in security, data protection, extreme scalability, and automation, for unstructured data at the core, edge, or cloud. HPE ProLiant servers with all-NVMe and HPE Apollo 4000 systems deliver high IOPS, high throughput, and low latency for workloads dealing with large or small files. But this solution also delivers granular real-time and historical analytics as well as a fully programmable API, so organizations can quickly troubleshoot problems, truly understand how applications use storage, and integrate with reporting and development resources.
- One customer used HPE storage with Qumulo to launch a new digital, aerial photography service that demanded fast data processing. The HPE/Qumulo system provided the right balance of performance, capacity, and security, enabling the company to launch a completely new revenue stream.
- Another customer that manages documents for financial organizations moved to HPE storage with Qumulo to eliminate the massive storage waste in its previous system. This company manages 30 billion files, under heavy load, with data-intensive workloads using both large and small files. The company achieved higher ROI on its storage investment, reducing power, cooling, and floorspace costs. The real-time visibility provided better business insights. This was a huge improvement from the previous storage vendor, which offered data analytics but with weeks of delay, rendering them of little use.
Some other examples of ways to benefit from HPE with Qumulo:
- During 2020, medical facilities have added storage capacity to deal with the high volumes of COVID-19 testing data, pulmonary imaging, etc. With HPQ/Qumulo, they will be able to quickly get details about exactly how the additional infrastructure was used to understand their additional costs during the pandemic.
- HPE/Qumulo is a great solution for high definition, 4K post-processing of video editing. This use case uses billions of small files or many large files and needs consistent high performance. If these organizations can understand how they used storage in developing one movie, they can provide more accurate details when bidding on the next movie.
- For video surveillance deployments, HPE and Qumulo can help customers understand the number of cameras they can use based on precise details of performance and capacity, making capacity and camera upgrade planning simple.
ESG validated that the combined HPE/Qumulo solution delivers a high-performance storage platform for unstructured data with enterprise security, availability, data protection, scalability, efficiency, and automation. The granular, real-time, and historical analytics offer faster problem resolution, improved business decisions, and better ROI for your storage investment. Of course, any organization should evaluate the needs of its particular workloads before deciding on a storage solution. But if you have unstructured, data-intensive workloads and are looking for high-performance and real-time visibility into how applications are using storage, ESG recommends that you take a close look at the HPE/Qumulo solution.
HPE Solutions for Qumulo
1 Source: ESG Research Report, 2020 Technology Spending Intentions Survey, Feb 2020.
2 Note that the cluster was a small testing environment and was not designed for maximum performance or capacity.
This ESG Technical Review was commissioned by HPE and Qumulo and is distributed under license from ESG.
All trademark names are property of their respective companies. Information contained in this publication has been obtained by sources The Enterprise Strategy Group (ESG) considers to be reliable but is not warranted by ESG. This publication may contain opinions of ESG, which are subject to change from time to time. This publication is copyrighted by The Enterprise Strategy Group, Inc. Any reproduction or redistribution of this publication, in whole or in part, whether in hard-copy format, electronically, or otherwise to persons not authorized to receive it, without the express consent of The Enterprise Strategy Group, Inc., is in violation of U.S. copyright law and will be subject to an action for civil damages and, if applicable, criminal prosecution. Should you have any questions, please contact ESG Client Relations at 508.482.0188.
The goal of ESG Validation reports is to educate IT professionals about information technology solutions for companies of all types and sizes. ESG Validation reports are not meant to replace the evaluation process that should be conducted before making purchasing decisions, but rather to provide insight into these emerging technologies. Our objectives are to explore some of the more valuable features and functions of IT solutions, show how they can be used to solve real customer problems, and identify any areas needing improvement. The ESG Validation Team’s expert third- party perspective is based on our own hands-on testing as well as on interviews with customers who use these products in production environments.

Enterprise Strategy Group | Getting to the Bigger Truth™
Enterprise Strategy Group is an IT analyst, research, validation, and strategy firm that provides market intelligence and actionable insight to the global IT community.

