Brought to you by:
Enterprise Strategy Group  |  Getting to the Bigger Truth™

ESG TECHNICAL VALIDATION

Veritas NetBackup IT Analytics Protection Suite

Simplifying Data Protection Visibility and Management

By Kerry Dolan, Sr. IT Validation Analyst; and Vinny Choinski, Sr. IT Validation Analyst
FEBRUARY 2021

ESG Technical Validations

The goal of ESG Technical Validations is to educate IT professionals about information technology solutions for companies of all types and sizes. ESG Technical Validations are not meant to replace the evaluation process that should be conducted before making purchasing decisions, but rather to provide insight into these emerging technologies. Our objectives are to explore some of the more valuable features and functions of IT solutions, show how they can be used to solve real customer problems, and identify any areas needing improvement. The ESG Validation Team’s expert third-party perspective is based on our own hands-on testing as well as on interviews with customers who use these products in production environments.

Introduction

This report documents ESG’s validation of Veritas NetBackup IT Analytics with a focus on its data protection capabilities and how it helps organizations reduce risk and optimize resources and costs.

Background

Protecting data is an essential function of IT, but as data volumes grow, it can be challenging for organizations to ensure that all their data is protected properly and efficiently. According to ESG research, 53% of respondents report storing more than 500TB of backup data, and 67% report backup data volumes growing by more than 20% annually.
In addition to this data growth, IT complexity adds to the strain on infrastructure and staff. According to ESG research, 75% of respondents say their IT environment is more complex than it was two years ago. For data protection, this combination of data growth and IT complexity makes it difficult to know the protection status of an organization’s data and manage it optimally. Other challenges include resource utilization, backup performance, compliance with SLAs, ransomware attacks, and costs.
Figure 1. Increasing IT Complexity

In general, how complex is your organization’s IT environment relative to two years ago? (Percent of respondents, N=664)

Source: ESG, a division of TechTarget, Inc.

These challenges are a struggle for organizations regardless of their backup application(s) and whether they use on-premises or cloud storage. It is critical that IT has complete visibility into data protection, so they understand details such as:
  • The protection status of all backup jobs.
  • What data assets are under- or over-protected.
  • What data protection components are under- or over-utilized.
  • When they are approaching capacity limits.
  • The costs of protecting data in the cloud or on-premises.

Solution: Veritas NetBackup IT Analytics Protection Suite

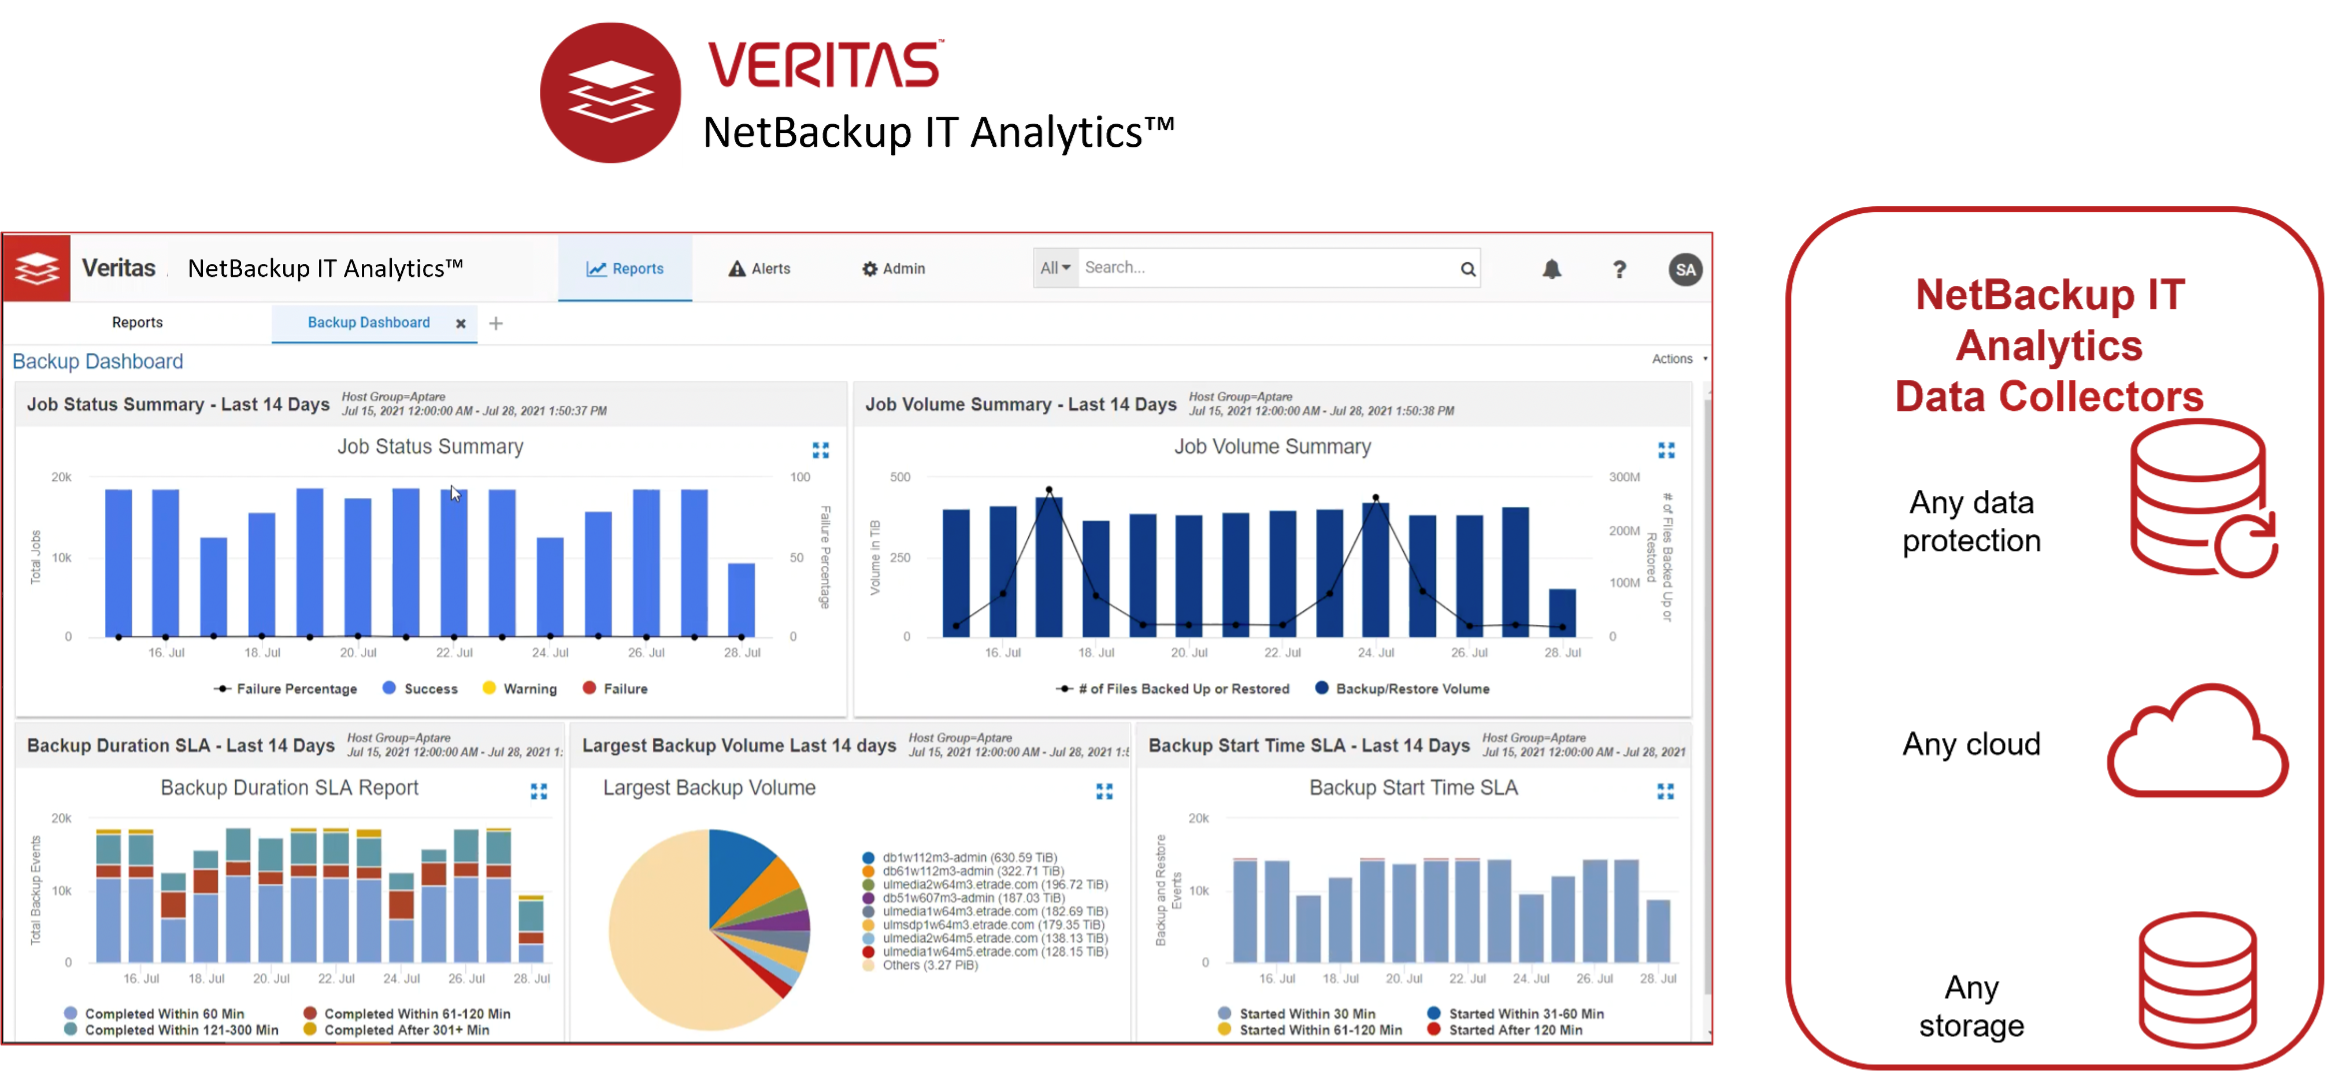
The NetBackup IT Analytics Protection Suite includes two components: Backup Manager for a consolidated view of the data protection environment and a Virtualization component to get a view of virtualization resources. NetBackup Backup Manager uses agentless data collectors to connect with NetBackup (and all leading enterprise data protection solutions), any on-premises storage, and any cloud storage, all viewable and managed through a single pane of glass. NetBackup Backup Manager allows administrators to view all attempted backups and reduces the exposure of unprotected data by automatically identifying clients and data sets that aren’t protected and assigned to a backup policy. It also delivers insights to solve backup problems such as “false positives” by identifying partial or failed backups that are reported as successful by the backup software.
Figure 2. NetBackup IT Analytics for Data Protection
Source: ESG, a division of TechTarget, Inc.

Key features include:

• Single pane of glass: Organizations can manage all multi-cloud and on-premises data protection assets from the dynamic, intuitive NetBackup user interface.
• Massive scalability: Agentless data collection and the central analytics engine enable scale that has been field-tested with Fortune 10 companies.
• Customization: Hundreds of predefined reports, built-in report designer, and drag-and-drop dashboard creation make customization easy.
• Flexibility: The solution offers vendor-agnostic support for a comprehensive set of storage arrays and vendors, backup applications and software, cloud vendors, and SAN devices.
• Multi-tenancy: The NetBackup analytics engine and database were designed to support multiple tenants and include views to simplify chargeback without manual research.
• Extensibility: IT teams and vendors can leverage NetBackup SDK capabilities to onboard unique subsystems.
• Multiple personas: NetBackup was designed to support multiple user profiles, including accounts for executives, operations, department-level, and even individual asset-level views.
Meeting backup compliance and corporate SLAs requires accurate and actionable insights to streamline the auditing process and ensure system recoverability. NetBackup IT Analytics Protection Suite provides insights that reduce data protection complexity and mitigate policy conflicts and human error. It automatically collects backup and data protection events, allowing access by internal and external auditors whenever required.
The NetBackup IT Analytics platform is based on a mature relational database that pools management data in a central location. The scalability of the database ensures accurate and reliable data collection and ensures that virtually any type of management information can be collected, analyzed, and shared. This enables organizations to know that their critical data is protected, to ensure that RPO and RTO SLAs are being met, to enable compliance reporting and chargeback, and to reduce costs. The user interface is built on open internet standards and web 2.0 technologies. Features such as drag and drop reports, tabbed browsing, and floating dialog boxes provide easy access to reports and customization of how needed information is viewed, organized, and shared.

ESG Technical Validation

ESG evaluated NetBackup IT Analytics for data protection using hands-on testing and live demos. Testing was designed to demonstrate how easy it is to view and manage the data protection environment, understand protection status, and optimize resources.
The test bed consisted primarily of a Veritas demo environment that included all NetBackup modules, NetBackup and other backup applications, plus numerous storage arrays, hosts, and cloud resources. We logged in with demo credentials that provided complete access. Our testing revealed how NetBackup IT Analytics for data protection can help increase visibility into the data protection environment, provide insight and details to improve resource utilization and performance, mitigate risk, and reduce costs. Note that our review only scratches the surface of the wide range of analytics available with NetBackup.

Increasing Visibility for Proactive Management

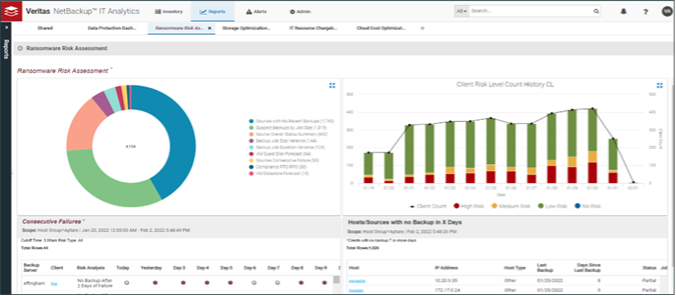
ESG began by examining the use of NetBackup reports and dashboards that provide a data protection environment overview. NetBackup analyzes metadata regarding known backups, policies, infrastructure, and applications and can identify anomalies in job duration, image sizes, etc.; NetBackup then uses this information to populate numerous out-of-the-box reports and pre-defined dashboards focused on data protection. For example, Figure 3 shows a list of reports available for Data Protection Risk Mitigation, including reports of variance in backup job duration, which can indicate a problem; the disk pool forecast for NetBackup, which can let admins know when the storage pool will run out; hosts without any recent backups; and backup jobs that are suspect because the size doesn’t match what is expected. The green checks indicate that these are included in the license for the environment and that data has been collected; the descriptions help admins understand what the report will tell them. This information helps alert admins to backup problems as soon as possible and prevents problems such as running out of disk space, without their having to do hours of tedious research.
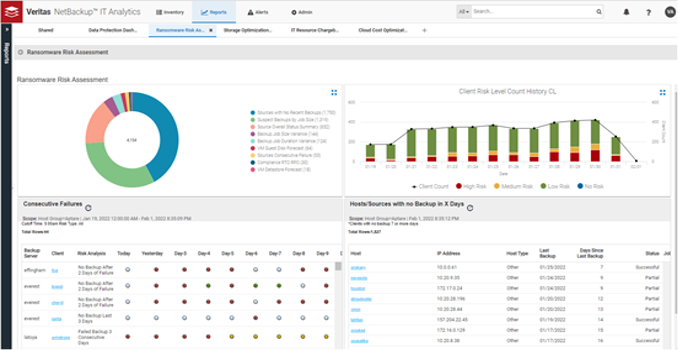
Next, we looked at the Risk Mitigation Analysis chart that aggregates several of these reports. Because virtualized resources were included in this environment, VM datastore and guest disk forecasts were included. We clicked on the green segment and could view the detail of backup jobs size variance by source name, which we then sorted by percent of variance to see which jobs were most suspect. This can alert an admin to check that the hosts with the greatest variance are backing up properly.
Figure 3. Data Protection Risk Mitigation Reports
Source: ESG, a division of TechTarget, Inc.

Figure 4. Data Protection Risk Mitigation Reports

Source: ESG, a division of TechTarget, Inc.

NetBackup searches across the appropriate resources—backup solutions, servers, and storage—and reports back the data in list or graphical format. Admins can create dashboards that include as many different reports as needed to provide an overview; this eliminates the need to run individual reports and try to visualize the overall status and health and then run them all repeatedly to ensure risks are mitigated. Users can:
  • Easily create their own dashboards by simply opening reports and dragging the results into a dashboard. ESG created a dashboard with four charts in a matter of seconds.
  • Tailor dashboards to focus on specific details.
  • Refresh, expand, or delete dashboard items with one click.
  • Change the scope of a chart with a clickable selector.
  • Drill down on a chart data point for additional detail.
For example, the Data Protection Dashboard in Figure 5 displays a high-level overview that includes key metrics. The Job Status Summary reveals the number and percentage of backup successes, warnings, and failures; at a glance, administrators can view the number of jobs per day and the success rate. The Job Volumes Summary displays both job sizes and numbers of files for data protection jobs (backups or restores) over time; mousing over a bar or point in the line displays either the total size or total files for that day’s job. Administrators can also view pie charts showing the numbers of Protected/Unprotected Hosts, Protection Status-Last 24 Hours (showing backup successes, warnings, and failures), and Data Protection by Vendor (showing the number of backups by backup application).
Figure 5. Data Protection Dashboard

Source: ESG, a division of TechTarget, Inc.

Most charts are clickable to drill down. On the Protection Status chart, ESG clicked on the yellow area to view details of the jobs with warnings. Figure 6 shows the numerous warnings of partial backups. This enables admins to know when backups have not completed properly, so they can be proactive in preventing the untimely interruption of a backup being needed but not available. The detailed view showed sources, servers, backup applications, job types, start and finish dates and times, duration, data volumes, performance in volume/second, number of files, and tape IDs. Highlighted details are clickable; for example, clicking on a server name displayed complete host details, and clicking on Finish Dates displayed complete job details. Having visibility into details such as clients with missed backups, failed jobs, skipped files, etc. informs administrators of potential recoverability risks, which can then be proactively resolved.
Figure 6. Protection Status Warning Details

Source: ESG, a division of TechTarget, Inc.

Another way to look at data protection is through a compliance lens. Figure 7 shows a compliance dashboard that answers important questions, as shown below the figure.
Figure 7. Compliance Dashboard

Source: ESG, a division of TechTarget, Inc.

  • Storage capacity changes (Is there enough storage configured for the backups?).
  • An SLA report for backup duration (How often were backups completed within the backup window?).
  • An SLA report for backup status (What percent of backups were successful, had warnings, or failed?).
  • A seven-day view of backup sources (Which sources had no backups at all, and which were successful, warned, or failed?).
  • An RTO/RPO report (Are there full and incremental backups? What are the recovery time and recovery points for each client? Is there a gap that would results in data loss?).
This information can help administrators to ensure that data protection SLAs are being met, and if they are not, where the problems lie for faster resolution. NetBackup also enables admins to create alerts, such as for backup failures, NetBackup store pool thresholds, etc. Alerts can be organized into a dashboard as well and can include trendlines and summaries.
Data protection costs can increase rapidly, and in the cloud, admins are often unaware of growing costs until the bill arrives. NetBackup provides numerous cost-related reports that can keep admins up to date. For example, there are reports for NetBackup Azure and AWS storage consumption and cost; in addition, the Billing & Chargeback Summary or the Server Consumption Summary help multi-tenant or ITaaS environments to simplify cost distribution. NetBackup captures the actual, detailed CPU and memory usage information from VM guests, which can be used to “right size” hosts moving to the cloud. This additional detail can deliver significant cloud savings.
Figure 8 shows an example of a Cloud Spend over Time dashboard, with NetBackup storage shown in the blue and orange segments of each bar. Mousing over each segment of a bar shows the exact costs per date.
Figure 8. Cloud Spend over Time

Source: ESG, a division of TechTarget, Inc.

There are many other reports and dashboards that can increase visibility and understanding regarding the data protection environment. For example, backup throughput reports can help admins to find and resolve bottlenecks; an intelligent engine and machine learning can speed root cause analysis. Organizations can also focus on specific resources, such as NetBackup master servers, to evaluate performance, check job counts, and review catalog sizes to ensure their health.

Why This Matters

Most organizations struggle to truly understand the status of their data protection environments. The lack of visibility can leave them vulnerable to data loss, poor resource utilization, and higher costs.
With NetBackup IT Analytics Protection Suite, organizations gain a holistic view of their data protection environment: backup status, resource utilization, anomalies that may indicate problems, and costs. Supporting any data protection application, any storage, and any cloud, NetBackup provides detailed reports, and organizations can create dashboards that aggregate information into clear overviews. Armed with full visibility, organizations can find and protect under- or un-protected data; proactively add resources before capacity thresholds are reached; reduce the risk of data loss or SLA misses; repurpose underutilized assets to enhance profitability; and easily understand resource usage for chargeback.

The Bigger Truth

As data volumes continue to grow and IT continues to increase in complexity, many organizations struggle to: A) understand their data protection status across heterogeneous on-premises and cloud resources; B) reduce risks of data loss; and C) identify ways to optimize resources and reduce costs. Veritas NetBackup IT Analytics Protection Suite enables organizations to gain full visibility across their data protection environment to improve backup optimization, capacity planning, risk mitigation, and cost reduction.
ESG validated that, with NetBackup IT Analytics for data protection, organizations can:
  • Increase visibility with actionable insights across the data protection environment, including on-premises and cloud resources. NetBackup provides high level overviews as well as detailed reports so admins understand data protection successes and failures, eliminating blind spots that can result in data loss and higher costs.
  • Optimize resources, improving utilization, performance, and costs. For example, with instant views instead of hours of manual search, organizations can see what resources are under- or over-utilized and make changes to improve performance, understand what data is under- or over-protected and make changes to improve protection and reduce costs, and streamline chargeback for multi-tenant environments.
  • Mitigate risks across hybrid environments. Proactive reporting helps admins understand the protection status of all data, resource availability, capacity forecasts, and much more. They can ensure that no data is left unprotected; that data protection servers, storage, and applications are functioning optimally; and that both data and catalogs are supported by sufficient infrastructure.
  • Increase capacity forecast accuracy. Organizations need to understand what data protection infrastructure they need. NetBackup’s data collection across all sources in any hybrid environment ensures that organizations always understand growth rates and trends. This results in higher success rates, more accurate budgets, and optimal purchasing.
While many customers share common data protection pains, each customer has different needs, and their staff requires different views, etc. One of the best features of NetBackup IT Analytics Protection Suite is the wide range of reports and charts that customers can easily tailor to include the information they need, in the way they want to view it. ESG also believes that creating out-of-the-box chart bundles to include the most common data protection needs would get customers started more quickly. So, if your organization needs better visibility and actionable insight for your heterogeneous data protection environment, ESG recommends taking a good look at Veritas NetBackup IT Analytics Protection Suite.
Get visibility into everything with predictive analytics software for multi-vendor backup, storage, and virtual infrastructures.
LEARN MORE

This ESG Technical Validation was commissioned by Veritas and is distributed under license from ESG.

All product names, logos, brands, and trademarks are the property of their respective owners. Information contained in this publication has been obtained by sources TechTarget, Inc. considers to be reliable but is not warranted by TechTarget, Inc. This publication may contain opinions of TechTarget, Inc., which are subject to change. This publication may include forecasts, projections, and other predictive statements that represent TechTarget, Inc.’s assumptions and expectations in light of currently available information. These forecasts are based on industry trends and involve variables and uncertainties. Consequently, TechTarget, Inc. makes no warranty as to the accuracy of specific forecasts, projections or predictive statements contained herein.

This publication is copyrighted by TechTarget, Inc. Any reproduction or redistribution of this publication, in whole or in part, whether in hard-copy format, electronically, or otherwise to persons not authorized to receive it, without the express consent of TechTarget, Inc., is in violation of U.S. copyright law and will be subject to an action for civil damages and, if applicable, criminal prosecution. Should you have any questions, please contact Client Relations at cr@esg-global.com.

Enterprise Strategy Group | Getting to the Bigger Truth™

Enterprise Strategy Group is an IT analyst, research, validation, and strategy firm that provides market intelligence and actionable insight to the global IT community.