Brought to you by:
Enterprise Strategy Group | Getting to the Bigger Truth™
ESG TECHNICAL VALIDATION
Veritas NetBackup IT Analytics Protection Suite
Simplifying Data Protection Visibility and Management
By Kerry Dolan, Sr. IT Validation Analyst; and Vinny Choinski, Sr. IT Validation Analyst
FEBRUARY 2021
ESG Technical Validations
Introduction
Background
Figure 1. Increasing IT Complexity
In general, how complex is your organization’s IT environment relative to two years ago? (Percent of respondents, N=664)
Source: ESG, a division of TechTarget, Inc.
- The protection status of all backup jobs.
- What data assets are under- or over-protected.
- What data protection components are under- or over-utilized.
- When they are approaching capacity limits.
- The costs of protecting data in the cloud or on-premises.
Solution: Veritas NetBackup IT Analytics Protection Suite
Figure 2. NetBackup IT Analytics for Data Protection
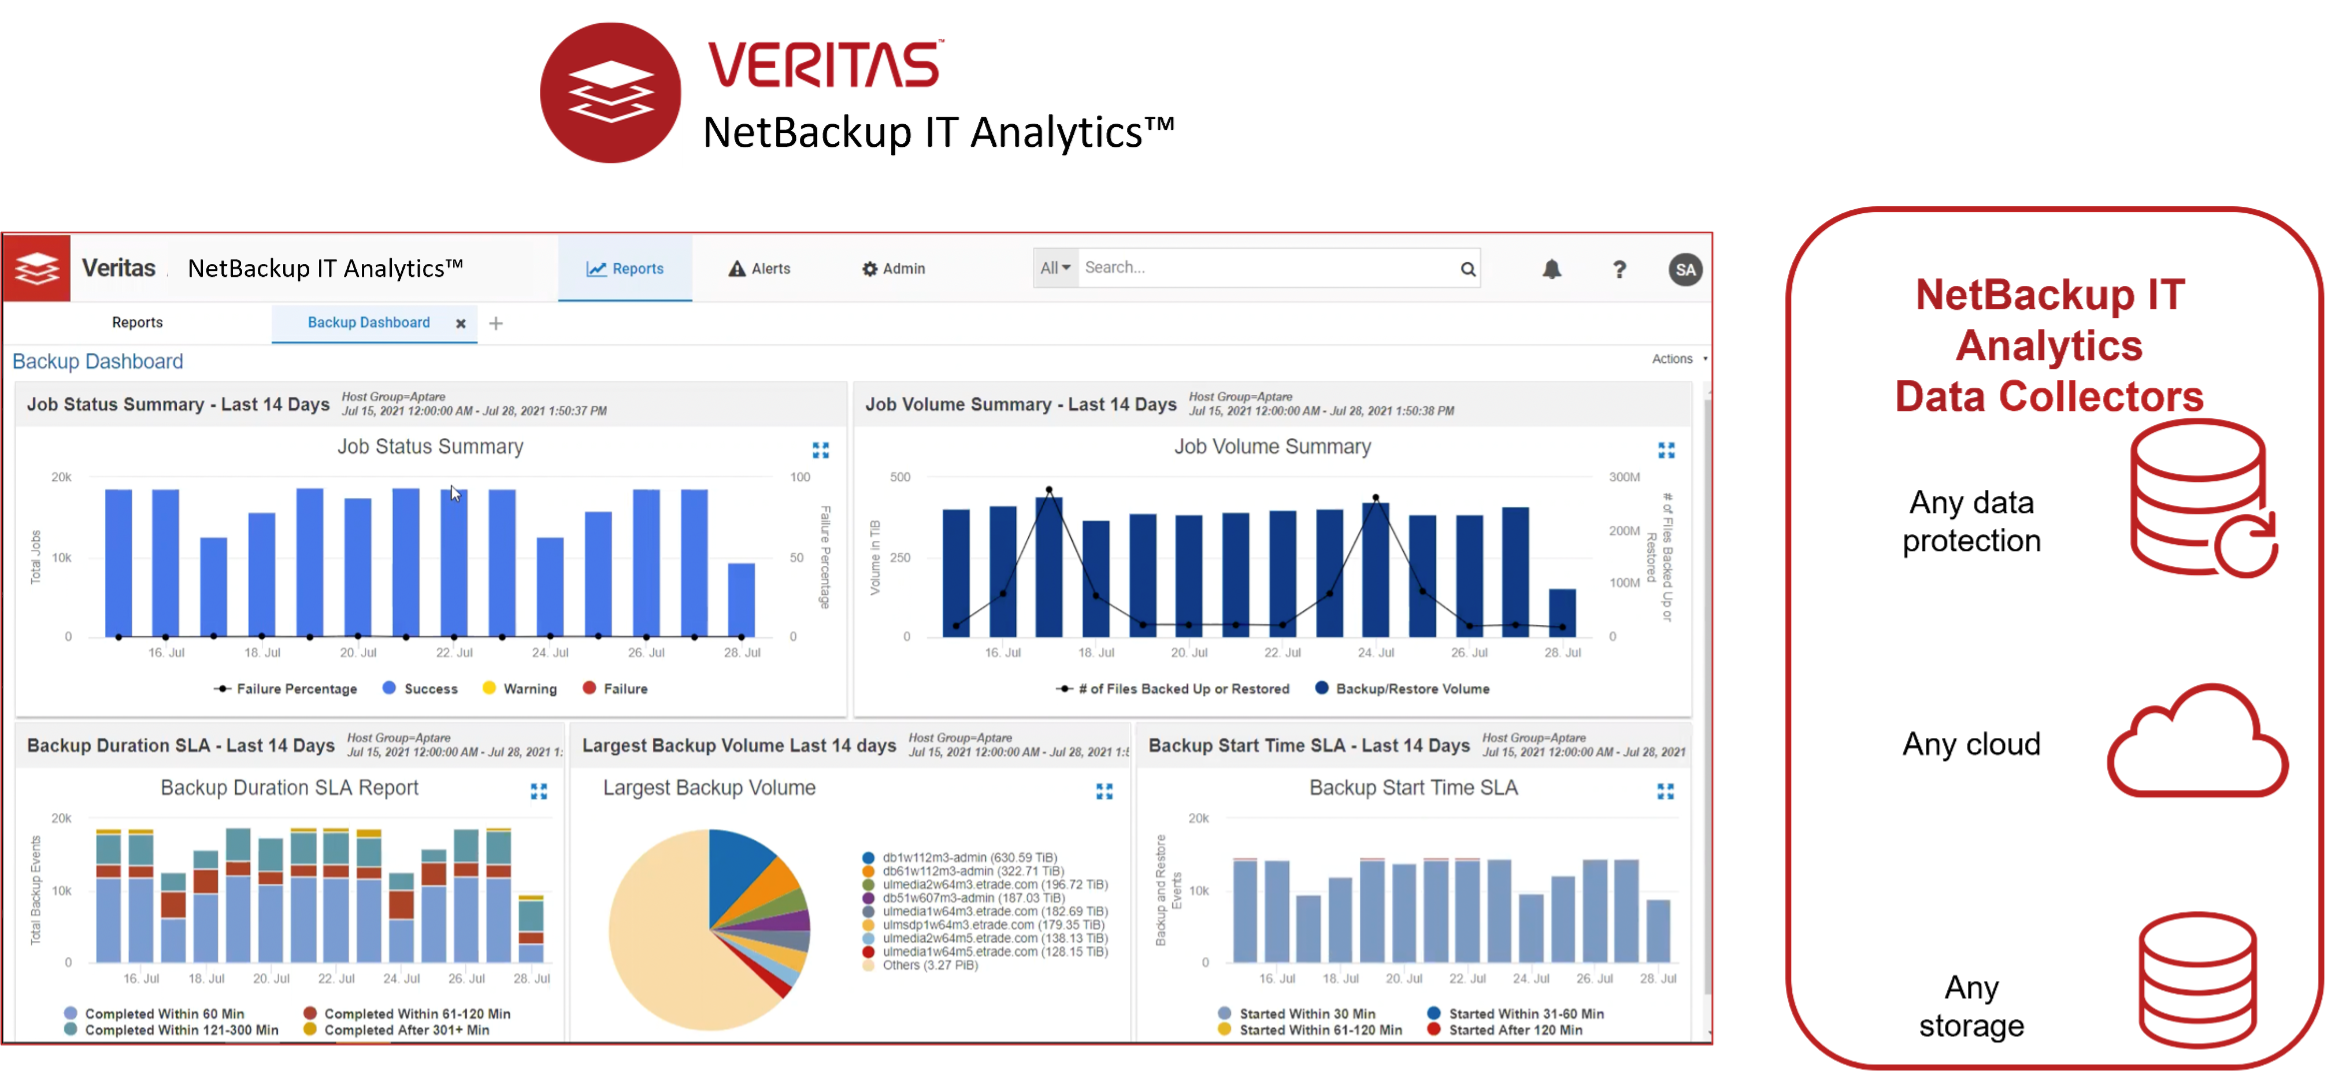
Source: ESG, a division of TechTarget, Inc.
Key features include:
ESG Technical Validation
Increasing Visibility for Proactive Management
Figure 3. Data Protection Risk Mitigation Reports
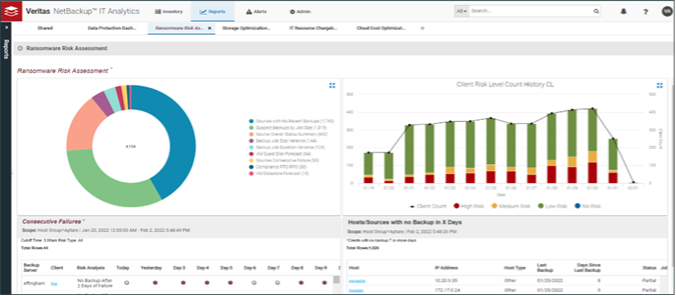
Source: ESG, a division of TechTarget, Inc.
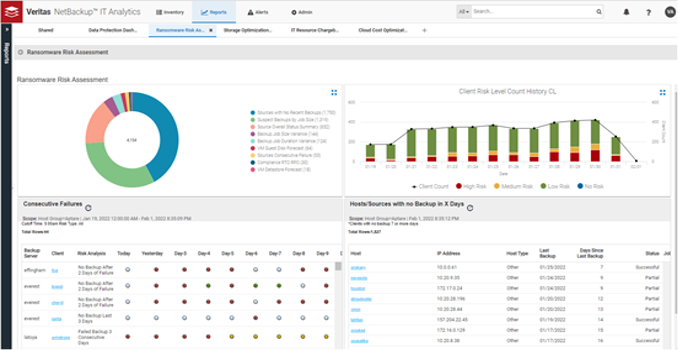
Figure 4. Data Protection Risk Mitigation Reports
Source: ESG, a division of TechTarget, Inc.
- Easily create their own dashboards by simply opening reports and dragging the results into a dashboard. ESG created a dashboard with four charts in a matter of seconds.
- Tailor dashboards to focus on specific details.
- Refresh, expand, or delete dashboard items with one click.
- Change the scope of a chart with a clickable selector.
- Drill down on a chart data point for additional detail.
Figure 5. Data Protection Dashboard
Source: ESG, a division of TechTarget, Inc.
Figure 6. Protection Status Warning Details
Source: ESG, a division of TechTarget, Inc.
Figure 7. Compliance Dashboard
Source: ESG, a division of TechTarget, Inc.
- Storage capacity changes (Is there enough storage configured for the backups?).
- An SLA report for backup duration (How often were backups completed within the backup window?).
- An SLA report for backup status (What percent of backups were successful, had warnings, or failed?).
- A seven-day view of backup sources (Which sources had no backups at all, and which were successful, warned, or failed?).
- An RTO/RPO report (Are there full and incremental backups? What are the recovery time and recovery points for each client? Is there a gap that would results in data loss?).
Figure 8. Cloud Spend over Time
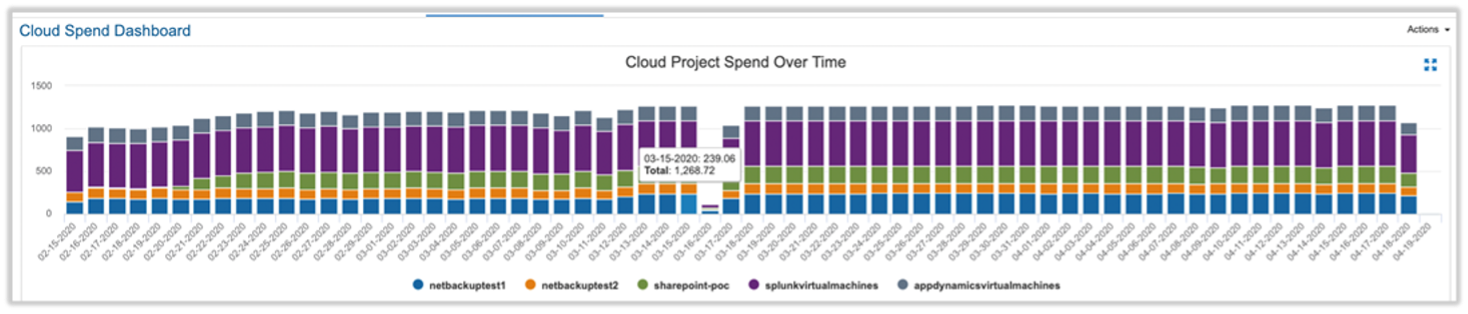
Source: ESG, a division of TechTarget, Inc.
Why This Matters
The Bigger Truth
- Increase visibility with actionable insights across the data protection environment, including on-premises and cloud resources. NetBackup provides high level overviews as well as detailed reports so admins understand data protection successes and failures, eliminating blind spots that can result in data loss and higher costs.
- Optimize resources, improving utilization, performance, and costs. For example, with instant views instead of hours of manual search, organizations can see what resources are under- or over-utilized and make changes to improve performance, understand what data is under- or over-protected and make changes to improve protection and reduce costs, and streamline chargeback for multi-tenant environments.
- Mitigate risks across hybrid environments. Proactive reporting helps admins understand the protection status of all data, resource availability, capacity forecasts, and much more. They can ensure that no data is left unprotected; that data protection servers, storage, and applications are functioning optimally; and that both data and catalogs are supported by sufficient infrastructure.
- Increase capacity forecast accuracy. Organizations need to understand what data protection infrastructure they need. NetBackup’s data collection across all sources in any hybrid environment ensures that organizations always understand growth rates and trends. This results in higher success rates, more accurate budgets, and optimal purchasing.
This ESG Technical Validation was commissioned by Veritas and is distributed under license from ESG.
All product names, logos, brands, and trademarks are the property of their respective owners. Information contained in this publication has been obtained by sources TechTarget, Inc. considers to be reliable but is not warranted by TechTarget, Inc. This publication may contain opinions of TechTarget, Inc., which are subject to change. This publication may include forecasts, projections, and other predictive statements that represent TechTarget, Inc.’s assumptions and expectations in light of currently available information. These forecasts are based on industry trends and involve variables and uncertainties. Consequently, TechTarget, Inc. makes no warranty as to the accuracy of specific forecasts, projections or predictive statements contained herein.
This publication is copyrighted by TechTarget, Inc. Any reproduction or redistribution of this publication, in whole or in part, whether in hard-copy format, electronically, or otherwise to persons not authorized to receive it, without the express consent of TechTarget, Inc., is in violation of U.S. copyright law and will be subject to an action for civil damages and, if applicable, criminal prosecution. Should you have any questions, please contact Client Relations at cr@esg-global.com.
Enterprise Strategy Group | Getting to the Bigger Truth™
Enterprise Strategy Group is an IT analyst, research, validation, and strategy firm that provides market intelligence and actionable insight to the global IT community.